BCL Advanced Stat Machines
LONDON (England) - As 2019 begins, so does the business end of the season. We are over halfway through the Regular Season and teams that started hot, now have to prove they can maintain stamina over a full season. Teams that took their time to find a flow, now have the chance to put it all together at the right time. Let's have a look at the Advanced Stats (with some video thrown in for context) and see who is best placed to chase glory in the new year.
Efficiency
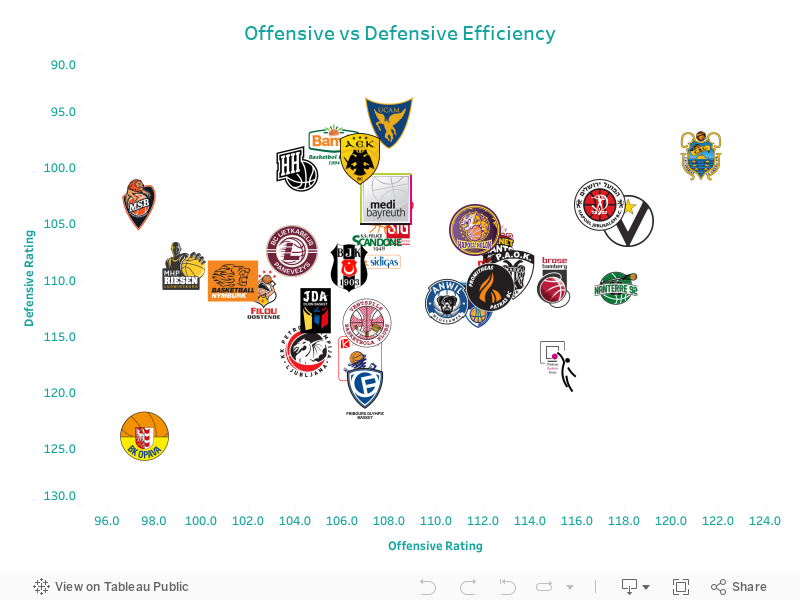
The viz above shows you all 32 teams in the BCL ranked by Offensive Rating (Points scored Per 100 Possessions) and Defensive Rating (Points allowed Per 100 Possessions). The Defensive Rating axis is reversed so the top right is where teams are aiming to be, bottom left not so good. If you hover over the team's badge, you will also see the team's Efficiency Differential (E Diff). Our three most efficient teams so far, are:
1. Iberostar Tenerife - E Diff: 22.3 (1st) , O Rtg: 121.3 (1st), D Rtg: 99 (2nd)
2. Hapoel Bank Yahav Jerusalem - E Diff: 13.6 (2nd), O Rtg: 117 (4th), D Rtg 103.4 (8th)
3. Segafredo Virtus Bologna - E Diff 13.4 (3rd), O Rtg: 118.2 (2nd), D Rtg 104.8 (10th)
Honorable mention: UCAM Murcia have the best D Rtg in the BCL at 96.1 but an O Rtg of 108 is ranked 15th making them our 4th most efficient team with an E Diff of 12.
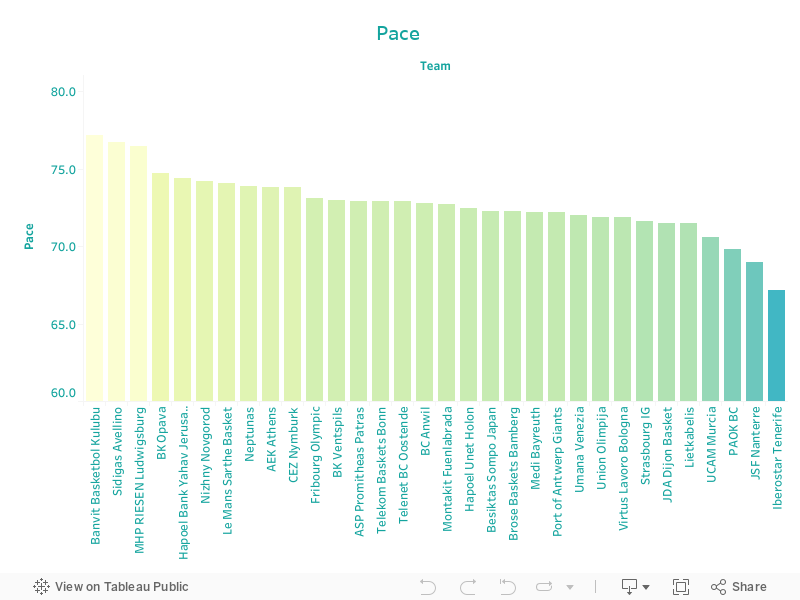
So why use Points Per 100 Possessions instead of Points Per Game? Well, PPG can be deceptive because some teams play at a higher Pace and have more possessions per game. More possessions allows more shots and potentially more points. For context, Iberostar Tenerife is 22.3 Points Per 100 Possessions better than it's opponents. The Canarians are easily our best Offensive team with an O Rtg of 121. 3 but score a comparatively low 82.7 PPG (9th) because they play at a league-lowest Pace of 67.2 Possessions Per Game. See the table below and you will see that Sidigas Avellino is the 3rd ranked BCL team for PPG and the 2nd ranked team for Pace despite being ranked 17th for O Rtg and E Diff.
Another piece of context to consider is that whilst Tenerife's O Rtg is impressive, it also has the BCL's bottom three ranked teams for D Rtg in its group; Opava, Fribourg Olympic and Telekom Baskets Bonn. It could be that its D Rtg is the more impressive number considering that its group also has three teams in the top ten for O Rtg in the BCL; Nanterre 92, Telekom Baskets Bonn and PAOK. The fact that Tenerife is ranked so highly in both categories, is undeniably telling.
Shooting
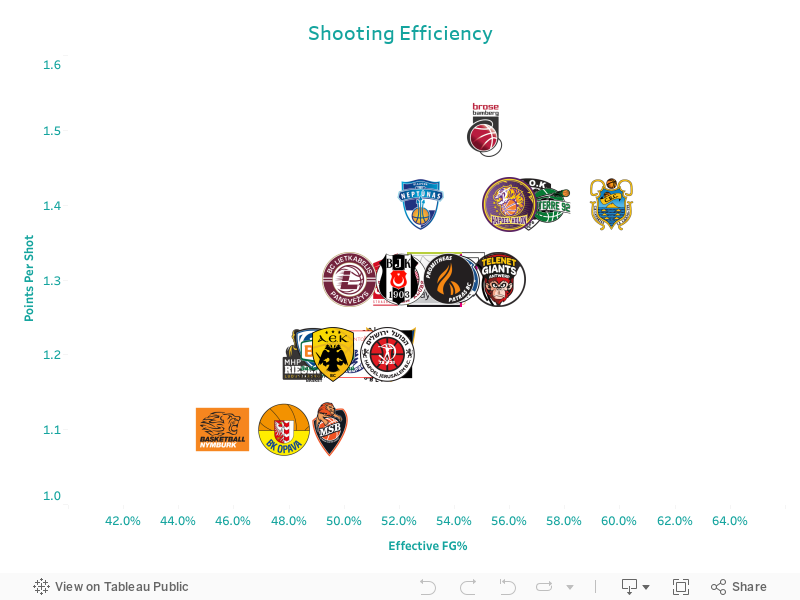
The first thing to evaluate when looking at our best shooting teams is how efficient they are at selecting the right shot and making the right shot. In the viz above you can see Effective Field Goal % (eFG%) and Points Per Shot (PPS). eFG% takes into account total shooting % for all FGA's, with the added value of the 3 -pointer considered. And PPS tell us exactly the number of points each team is scoring per FGA. Again top right is good and bottom left, not so good.
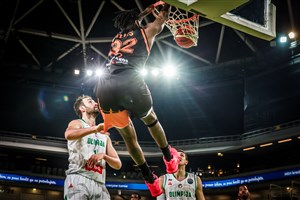
What you can see here is that Iberostar Tenerife and Brose Bamberg are leading the way for eFG% and PPS respectively. Tenerife is known for its 3-point shooting but its league-leading 2PFG% at 60.4% makes up many of its most efficient shots. The video below shows exactly what the Canarians are all about and why they aren't concerned by playing at a slower pace if it allows them to take efficient shots. In the first clip, Sebastien Saiz patiently sets three ball-screens before they finally hit him on the roll for the high% shot at the rim. Clip 2 is a blur of movement off the ball and pint point decision making. As usual, Tenerife take advantage of any mistake and get a shot right at the rim.
Interestingly, Bamberg has managed to score more PPS despite having a lower % from inside and outside the arc. This is thanks to the German's shot selection. Bamberg takes six more 2-point FGA's than Tenerife and eight less 3-point FGA's. The margin of difference created by the team's respective shooting %'s is, however, very narrow.
Free Throw shooting plays a huge part in winning basketball. If you need an example, then look no further than last year's champions AEK. The Queen took more FT's than any other team in the BCL last season and in fact, three of the Final Four team's were in the top four for FTA's last year.
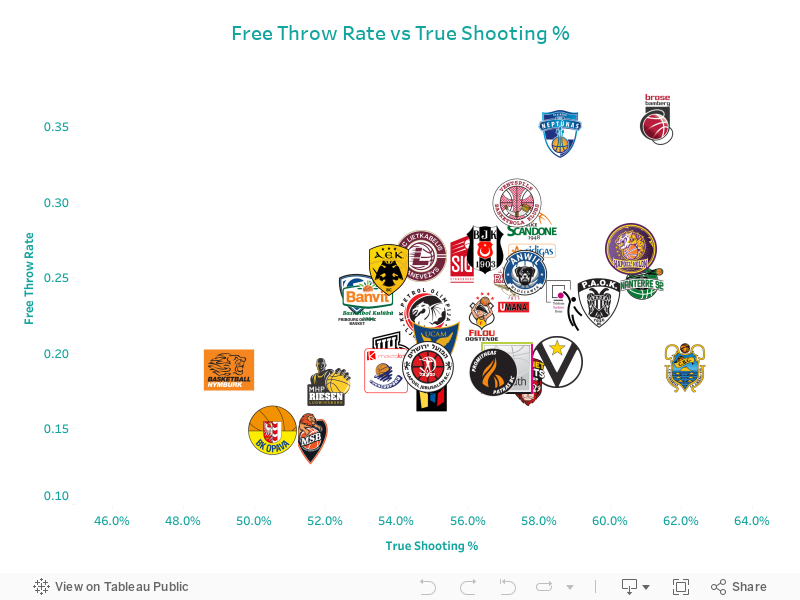
The viz above shows Free Throw Rate and True Shooting %. Free Throw Rate allows us to understand how often teams get to the line in comparison to the total number of FGA's they take. True Shooting % (TS%) is similar to eFG% in that it considers the percentage of all made FGA's but also considers FT % as well.
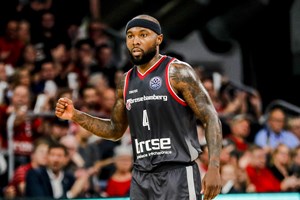
Again we see the same two teams leading the way. Tenerife ranked 1st with a TS% of 62.1%. Brose Bamberg has a top-ranked Free Throw Rate (0.36) and also shooting a TS% of 61.3% (2nd). When you watch the Germans play it's easy to see why they get to the line so often. Bamberg is as good as anyone in the BCL for interior passing. On every drive and post entry, they send big bodies like Elias Harris and Augustine Rubit cutting to the rim and find them with well-timed passes. Cliff Alexander is also growing into one of the BCL's best lob catchers.
All things considered, these are our three top shooting teams after nine games:
1. Iberostar Tenerife - eFG%: 59.7% (1st), PPS: 1.4 (2nd), TS% 62.1% (1st), Free Throw Rate: 0.19 (20th)
2. Brose Bamberg - eFG%: 55.1% (5th), PPS: 1.5 (1st), TS%: 61.3% (2nd), Free Throw Rate: 0.36 (1st)
3. Nanterre 92 - eFG%:57.4% (2nd), PPS: 1.4 (2nd), TS%: 60.9 (3rd), Free Throw Rate: 0.25 (10th)
Rebounding
The metric of choice here is Rebounding %. Again, why not use Rebounds Per Game (RPG)? For there to be a rebound somebody has to miss first. For that reason, RPG stats will always be at the mercy of FG%. If a team shoots well, they will always struggle to get as many offensive boards as a poor shooting team. That doesn't mean they are a worse rebounding team, it just means RPG is a flawed metric for measuring their ability to rebound. We don't measure a shooter's ability based on the number of shots they take.
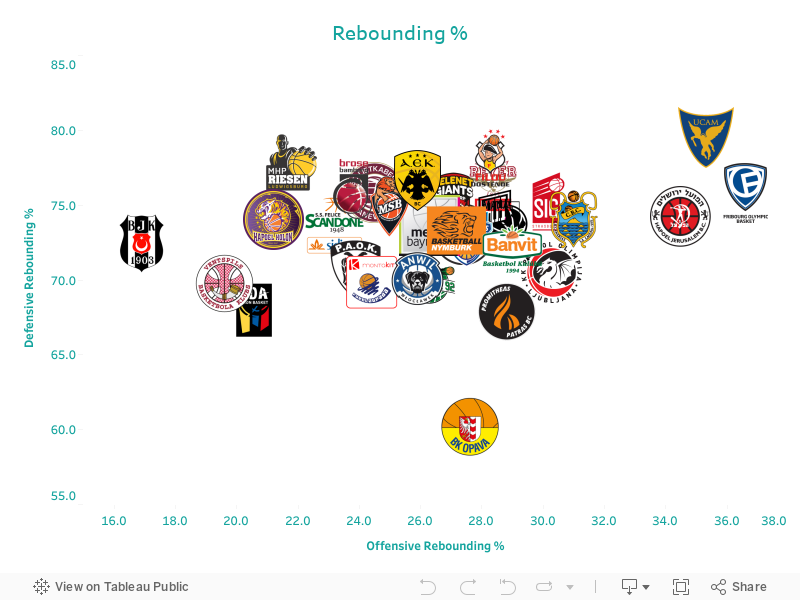
The viz above shows Offensive Rebound % (ORb%), Defensive Rebound% (DRb%) and if you hover over the team's badge, you see Total Rebound % (TRb%). Instantly in the top right of the viz we see three clear leaders:
1. UCAM Murcia - D Rb%: 79.5% (1st), O Rb%: 35.3% (2nd), T Rb%: 56.9% (1st)
2. Fribourg Olympic - D Rb%: 75.8% (7th), O Rb%: 36.6% (1st), T Rb%: 54.9% (2nd)
3. Hapoel Bank Yahav Jerusalem - D Rb%: 74.2% (13th), O Rb%: 34.5% (3rd), T Rb%: 54.2% (3rd)
There isn't a lot between these three teams. If you haven't read our feature with Jerusalem Assistant Coach Ryan Pannone, he took us on court to demonstrate some of the drills they use to work on rebounding and for most of the season, Jerusalem has been our top O Rb% team. Fribourg Olypic's position as our current top O Rb% is even more remarkable considering their current record. UCAM Murcia, on the other hand, has been our best T Rb% team all season.
The video below shows what they are all about. Sadiel Rojas is their captain and the spirit he plays with permeates the entire squad, from Ovie Soko's athleticism and motor to Rojas fighting spirit, the entire team goes after every loose ball and rebound like it was the last play of the game.
Possession
The last - but not least - important thing to look at, is how teams use the ball. Turnovers end possessions without a shot and assists often create higher % shots.
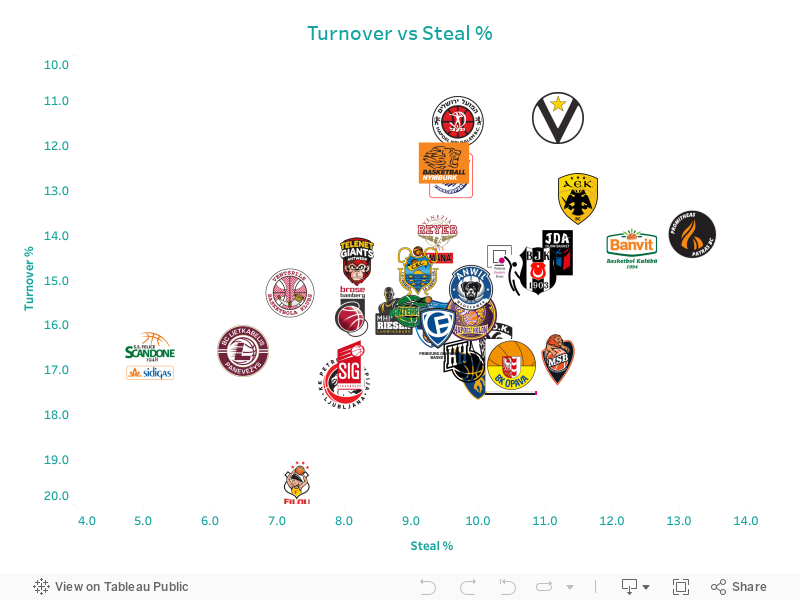
The viz above shows Turnover % (Tov%) and Steal %(Stl%), which take into account the number of possessions in every 100, that a team ends with a turnover or steal. The thing to notice is that the Tov% axis is reversed as the lower the % the better.
Virtus Bologna and Hapoel Jerusalem are the two best teams when it comes to Tov% at 11.4% and 11.5% respectively. The contrast between those two teams and Filou Oostende at the bottom with a 19.6 Tov%, is stark. The Belgians are in the hunt for a Play-Offs spot but will need to address their carelessness with the ball if they are to proceed. Maybe the standout team here is Promitheas Patras. The team from Patras has taken Ludwigsburg's mantle as the BCL's best pressing team this season. They are also excellent at reading passing lanes (Lypovvy and Brown particularly) and have a fantastic habit of stealing the ball from inbounds plays. Their Stl% of 13.2% is clearly the best in the league.
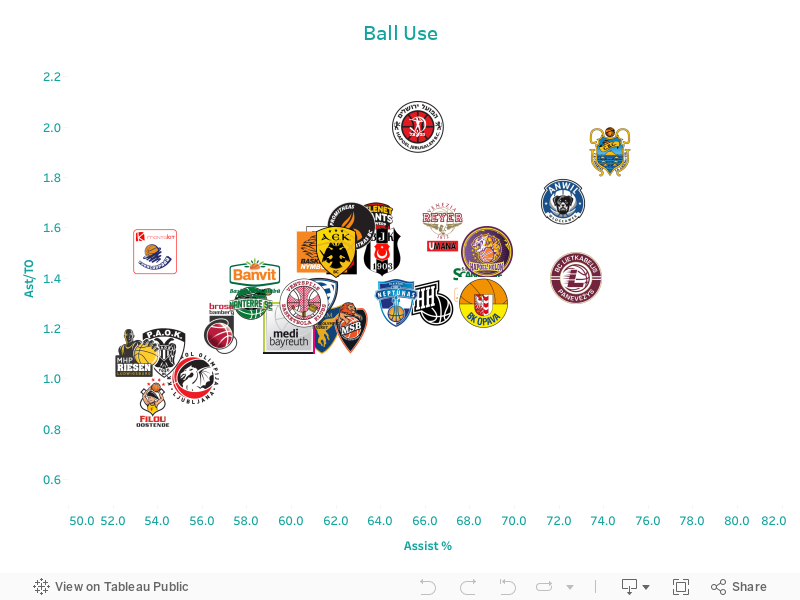
The last viz above is about the way team's pass the ball. A higher Assist to Turnover Ratio (Ast/TO) shows us the teams that distribute the ball well. A higher ratio of possessions ending in an assist instead of a turnover gives a higher score. Assist % (Ast%) shows us what % of a teams FG's are scored as a result of an assist. Team's that move the ball effectively and create shots for each other will score higher.
It's no surprise to see Iberostar Tenerife at the top of the Ast % rankings at 74.3%. Lietkabelis and Anwil are close behind with 72.8% and 72.2% respectively. Hapoel Jerusalem leads the Ast/TO ranking at 2.0 (thanks to a very low Tov%), with Tenerife coming in 2nd at 1.9. When it comes to gaining and using possession of the ball, it's a little harder to pick out a top three. What is clear is that Jerusalem and Tenerife would be present in the top three again.
Advanced Stat Machines
All of the teams mentioned in our top three's for each category have been advanced stat machines in their own right, but Iberostar Tenerife and Hapoel Bank Yahav Jerusalem are both top three, in three of the four categories. If the advanced data is telling us that any teams are set for glory in 2019, it would have to be these two clubs. Tenerife, in particular, had a very similar statistical profile the year they became our first champions.
Of course, stats only tell part of the story. Last year we saw AS Monaco come into the Final Four leading many advanced stat categories, but the late-season addition of Kevin Punter made AEK a completely different team and in the end, helped the Queen be crowned kings. It will be interesting to monitor these statistics again prior to the Final Four and see if our "Advanced Stat Machines" have been working in the Play-Offs.
The Basketball Champions League's columnists write on a wide range of topics relating to basketball that are of interest to them. The opinions they express are their own and in no way reflect those of FIBA or the Basketball Champions League.
The Basketball Champions League's takes no responsibility and gives no guarantees, warranties or representations, implied or otherwise, for the content or accuracy of the content and opinion expressed in the above article.